Setting Up Grafana Loki and Alloy for Docker: A Practical Guide From My Recent Battle


Setting Up Grafana Loki and Alloy for Docker: A Practical Guide From My Recent Battle
I recently had to implement logs collection for one of my applications, and I expected it to be one of those plug-and-play DevOps chores. It was not. Grafana has a pretty extensive documentation on the matter, but it's definitely not beginner friendly so I spent more time debugging my setup than I anticipated.
If you're building a small-to-medium product, or you're an indie developer trying to instrument your app, this guide walks you through a clean, minimal Loki + Alloy setup that actually works for Docker.
This article is not a Loki deep dive. It's aimed at helping you ship a working configuration without wasting days figuring out why Loki says "No logs volume" or why your timestamps are rejected as "too old".
Let's dive in.
The Big Picture: How Loki, Alloy, and Grafana Work Together
Loki is a very popular open source logs database that is free to use when you self-host it.
Alloy is Grafana's lightweight pipeline engine that replaces Promtail (deprecated). It reads logs from Docker and pushes them to Loki.
The setup looks like this:
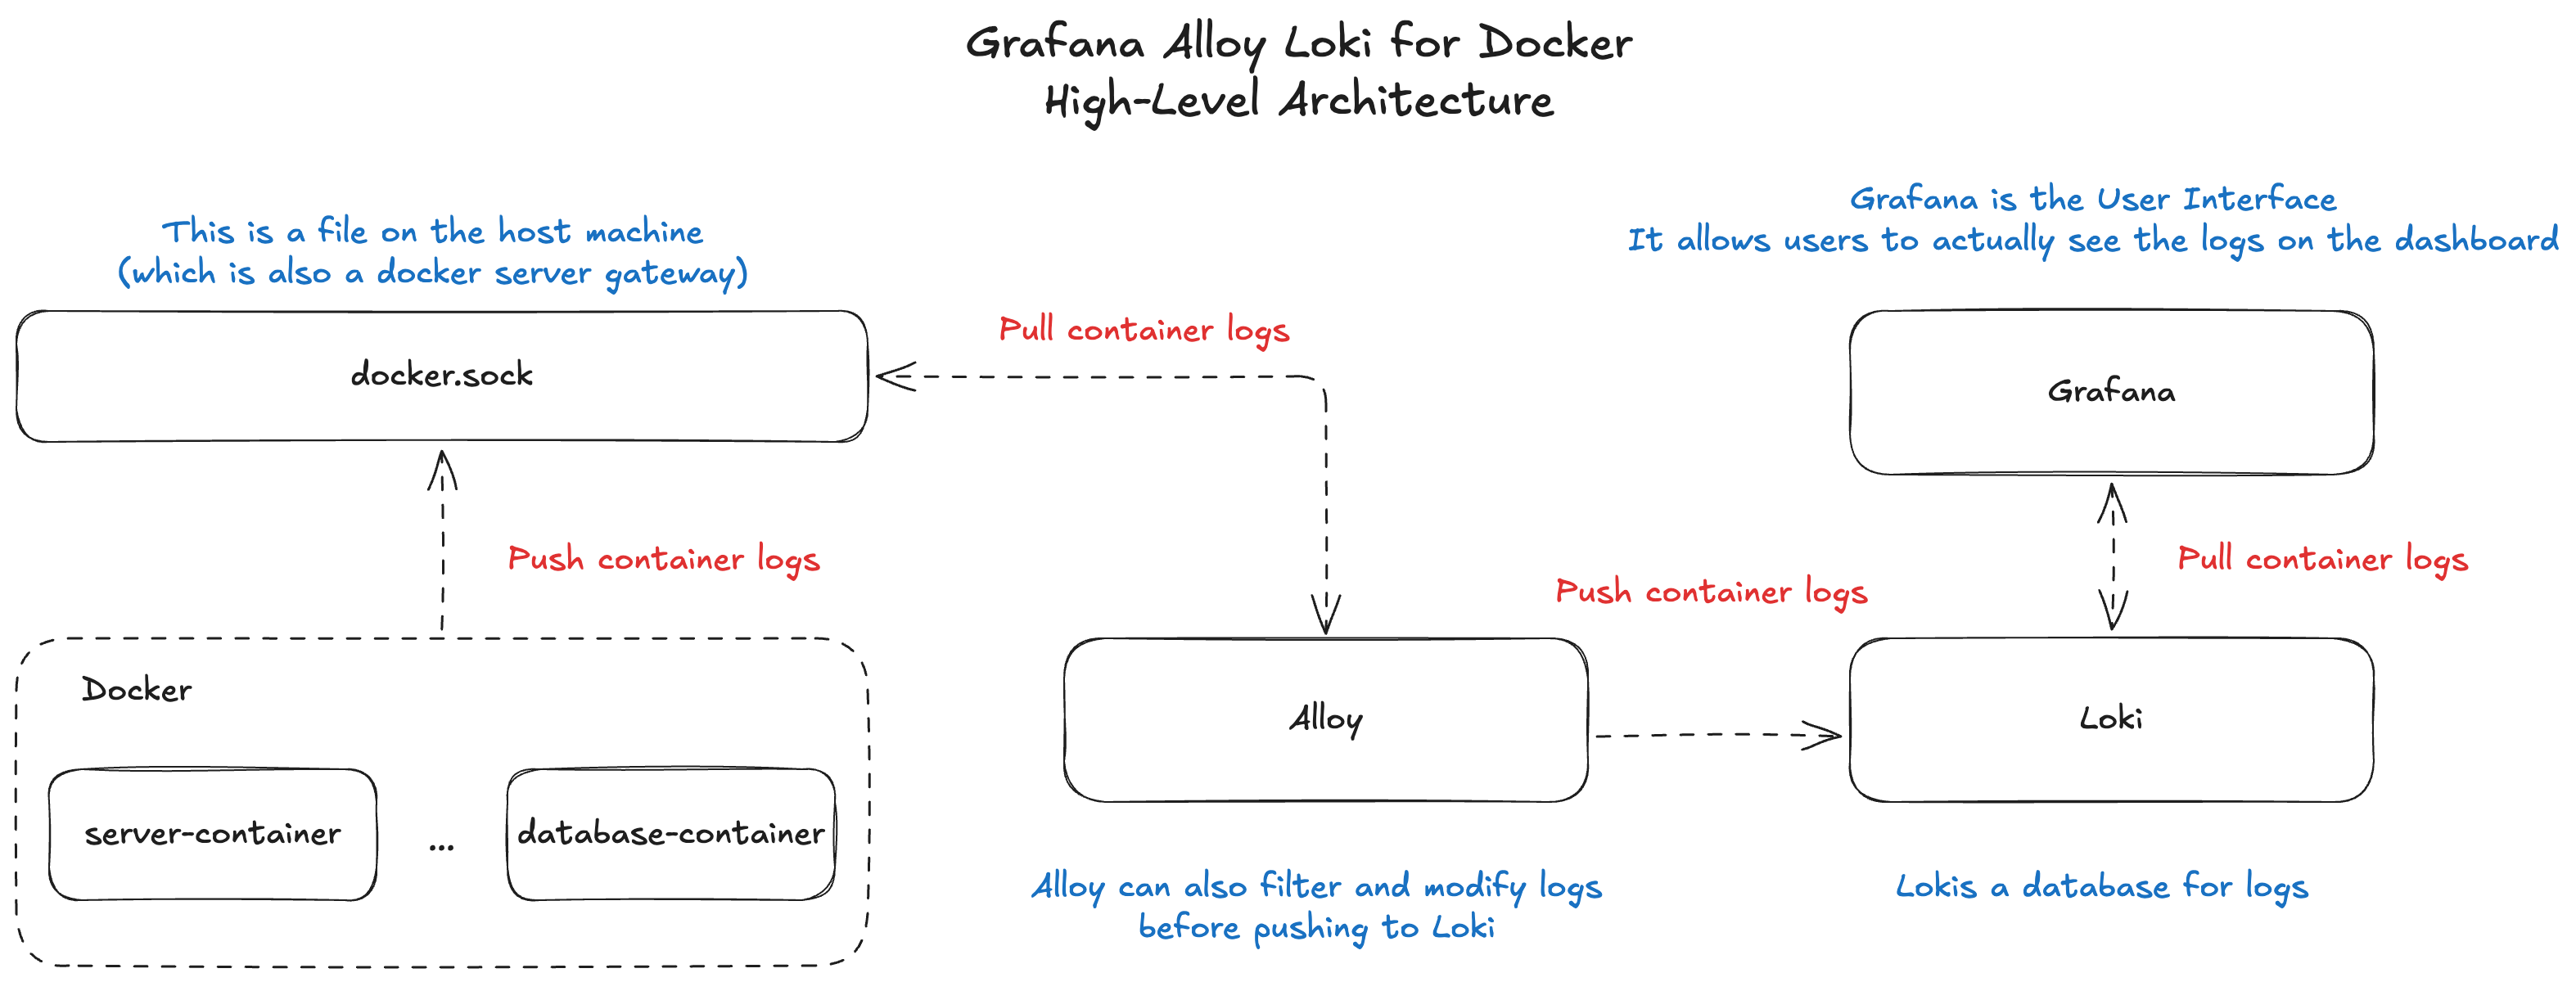
If you just want your app logs searchable in Grafana, this stack is perfect.
Now, let's see how to stich all the components together and actually allow you to see your application logs in Grafana UI. Let's go!
1. The Docker Compose Setup
If you haven't worked with Docker before, a docker-compose.yaml file is like a blueprint of your application. It defines what services it is made of, how they work together, and how they can be accessed from outside the containers.
In our case, we are building the four services: loki, grafana, alloy and the application server.
version: "3.8"

services:
  server:
    image: node:18
    working_dir: /app
    command: ["node", "server.js"]

  loki:
    image: grafana/loki:3.0.0
    ports:
      - "3100:3100"
    command: -config.file=/etc/loki/local-config.yaml
    volumes:
      # Copy the loki-config.yaml file from the root of your Git repo to the Loki container in Docker
      - ./loki-config.yaml:/etc/loki/local-config.yaml

  alloy:
    image: grafana/alloy:latest
    volumes:
      # IMPORTANT: This actually allows Alloy to connect to the docker.sock file which exists on your container's host machine
      - /var/run/docker.sock:/var/run/docker.sock
      - ./alloy-config.alloy:/etc/alloy/config.alloy
    command: --config.file=/etc/alloy/config.alloy
    depends_on:
      - loki

  grafana:
    image: grafana/grafana:11.0.0
    ports:
      - "3000:3000"
    volumes:
      - grafana-storage:/var/lib/grafana

volumes:
  grafana-storage:
If you are curious about the volumes definition, it's simply a piece of persistent storage created for one of the services defined in your docker-compose.yml file. It lets the files inside that volume stay around even after the container restarts or shuts down.
Important: Alloy needs access to /var/run/docker.sock or it cannot read container logs.
If you skip this volume, Alloy will run, but it will show 0 targets and nothing gets sent to Loki.
Don't run docker compose up -d just yet! We still need to add a few config files to make the whole thing work properly.
Let's get to work!
2. Minimalistic Alloy Configuration That Works
Save this as alloy-config.alloy on the same level as the docker-compose.yml:
// 1. Fetch logs coming from all your Docker containers
discovery.docker "local" {
  host = "unix:///var/run/docker.sock"
}

// 2.
// https://grafana.com/docs/alloy/latest/reference/components/loki/loki.source.docker/
loki.source.docker "app_logs" {
  host    = "unix:///var/run/docker.sock"
  targets = discovery.docker.local.targets

  // IMPORTANT: at least one label must be defined on every entry
  labels = {
    app = "your_app",
  }

  forward_to = [loki.write.grafana_loki.receiver]
}

// 3.
loki.write "grafana_loki" {
  endpoint {
    // Your Docker network will resolve "loki" to the proper IP address of the Loki container on the internal network
    url = "http://loki:3100/loki/api/v1/push"
  }
}
This config defines the Alloy pipeline with multiple stages that bring Docker logs to Loki. Here's what it does:
discovery.dockerdiscovers all running containers.loki.source.dockerattaches to each container's stdout and stderr.- Each log line gets the
applabel, which makes filtering easy in Grafana. - Logs then get shipped to Loki using
loki.write.
When you are just trying to make things work for the first time, you don't need any special filters, relabeling rules, or pipelines unless you want to customize the structure.
This setup alone gives you working logs that you can use a foundation and build a more complex solution on-top of it.
Important: This will fetch logs from all the running Docker containers. If you need to push logs from a specific container, you will need to add filters to your Alloy pipeline that you can implement using the discovery.relabel module - Grafana documentation.
Final piece is Loki configuration. Let's do this!
3. Loki Configuration
While setting everything up locally, Loki turned out to be the least of my troubles. I think any configuration file from the Grafana documentation will work fine, but just in case, I'm including the one that worked for me.
Save this as loki-config.yaml on the same level as the docker-compose.yml file:
auth_enabled: false

server:
  http_listen_port: 3100
  grpc_listen_port: 9095

common:
  path_prefix: /loki
  storage:
    filesystem:
      chunks_directory: /loki/chunks
      rules_directory: /loki/rules
  replication_factor: 1
  ring:
    kvstore:
      store: inmemory

schema_config:
  configs:
    - from: 2025-11-30
      store: tsdb
      object_store: filesystem
      schema: v13
      index:
        prefix: index_
        period: 24h

limits_config:
  ingestion_rate_mb: 10
  ingestion_burst_size_mb: 20
  max_streams_per_user: 0
  max_cache_freshness_per_query: 10m

querier:
  query_ingesters_within: 2h
This is it.
Run docker compose up -d and open http://localhost:3100 to see the Grafana UI 🟢
In order to see Loki logs in Grafana, you need to open the "Explore" tab and add a new "Loki" source.
Now, if something isn't working right away, let's troubleshoot!
4. The Most Common Errors You Will Face (And Why They Happen)
Error 1: "No logs volume available" (Grafana Loki UI)
This shows up when:
- Alloy is not reading Docker logs
- The Docker socket volume is missing
- Alloy config does not point to
discovery.docker.local.targets - Loki is running fine but receives no streams at all
Usually fixed by this line:
/var/run/docker.sock:/var/run/docker.sock
In my case, I tried adding custom targets like this:
targets = [{ container_name: "app-server" }]
That didn't work because targets expects a more complex shape and I only managed to make it work by passing discovery.docker.local.targets.
Good learning. Let's move next.
Error 2: "entry too far behind" or "timestamp too old"
Loki rejects logs older than the configured window.
Common causes: You've been running Docker for a while locally and Alloy tries to ingest all the older entries.
Consider adding the loki.process pipeline stage to your alloy-config.alloy configuration file:
// previous Alloy pipeline stages

loki.process "drop_old" {
  forward_to = [loki.write.loki.receiver]

  stage.drop {
    older_than          = "1h"
    drop_counter_reason = "too old"
  }
}

// loki.write definition here...
More details on the loki.process stage definition is on the Grafana website.
Final Thoughts
I thought that setting up Loki and Alloy would be simple, but while the Grafana documentation has enough information, it is scattered across multiple pages and sections. It makes it really hard to glue the pieces together when you are setting up the whole thing for the first time. My goal with this article was to give beginners a lean setup that works immediately or at least provide a roadmap that helps make the integration easier to navigate.
If you want to go deeper (structured logs, parsing JSON, filtering, alerting), this setup gives you a clean foundation to build on without wrestling with broken pipelines.
Quick Summary:
- Define the grafana, alloy, loki and the app server services in
docker-compose.yml - Create a
loki-config.yml - Create an
alloy-config.alloy - Don't forget to give access to
docker.sockfile to the alloy service - Check the common errors list to troubleshoot faster
If you liked this article, consider checking my previous article: A Practical Guide to Multi-Agent RAG Design
Until next time and happy coding! 🧑💻